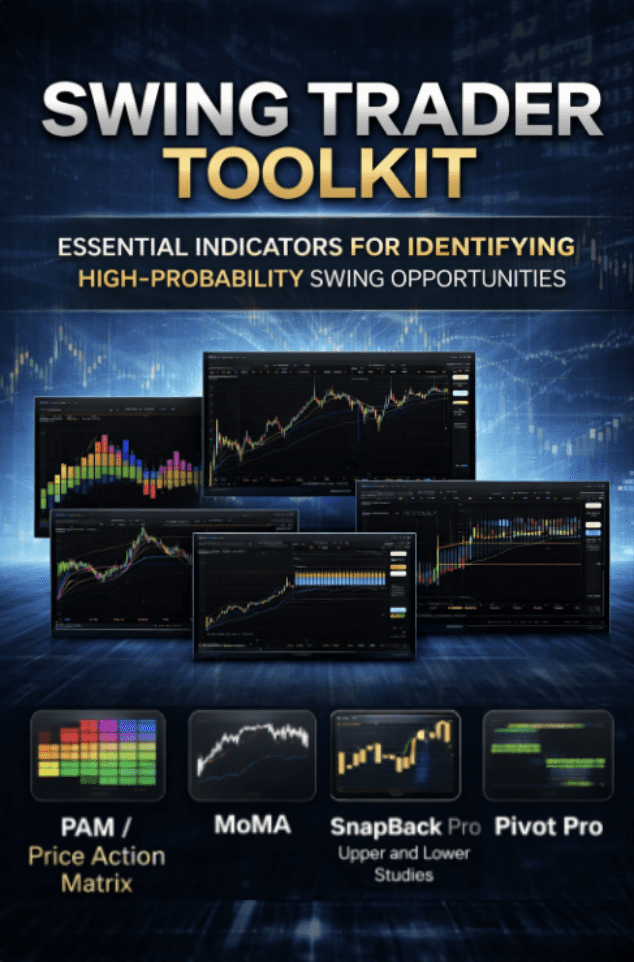


SWING TRADER TOOLKIT
Total Indicator Value: $397
Bundle Price: $249
You Save: $148
Includes Lifetime Updates
Essential Indicators for Identifying Swing Opportunities
The Swing Trader Toolkit is designed for traders who focus on capturing larger market moves over multiple days or weeks.
Instead of cluttering charts with unnecessary indicators, this bundle focuses on the most important elements of market behavior:
• trend alignment
• market structure
• support and resistance levels
• volatility extremes
Together, these tools help traders identify high-probability setups and improve entry and exit timing on swing trades.
Indicators Included
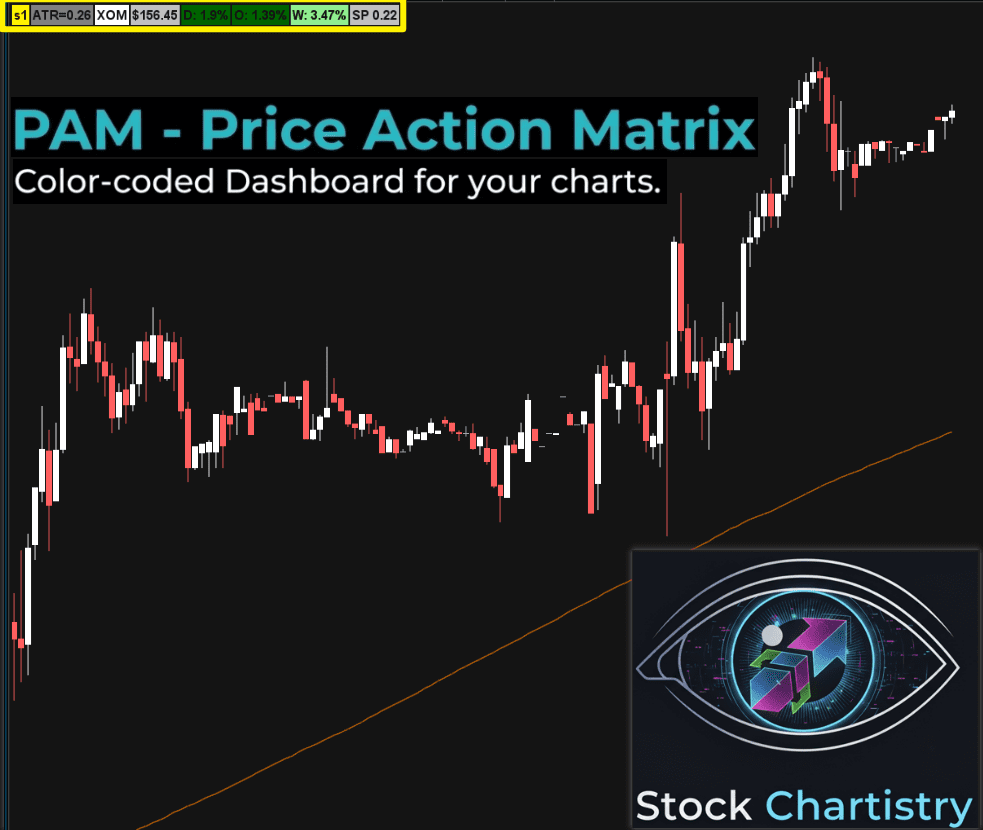
PAM / Price Action Matrix
A structured visualization of price behavior that reveals momentum shifts, compression zones, and market bias across multiple timeframes.
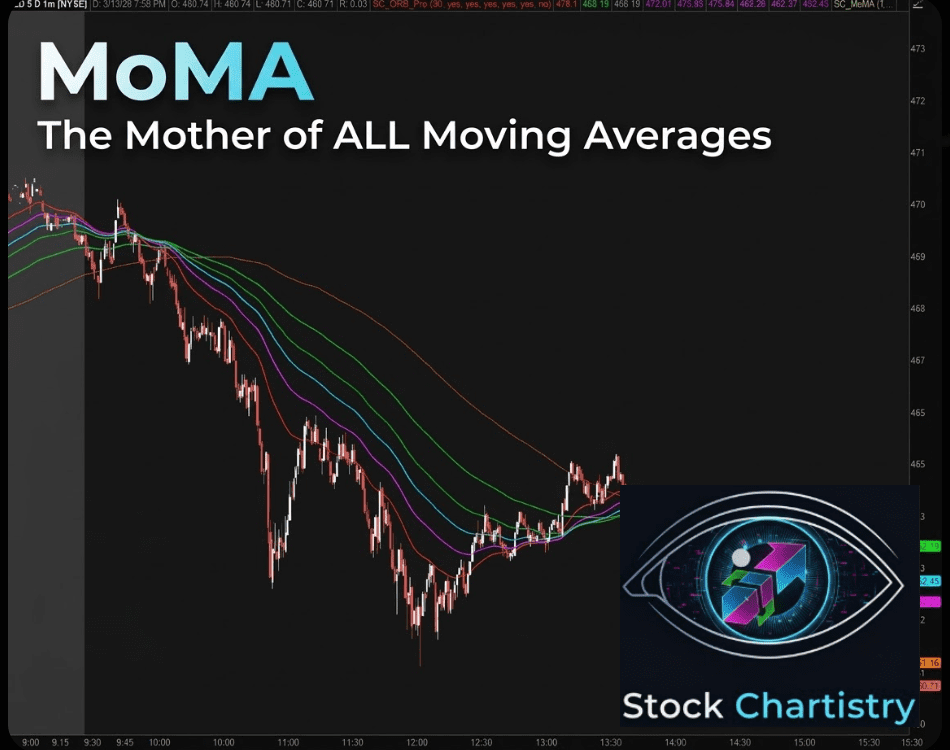
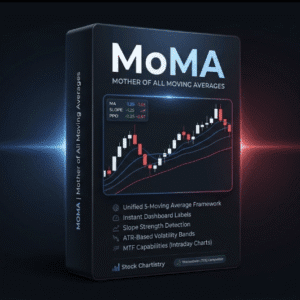
MoMA – The Mother of All Moving Averages
A multi-timeframe moving average framework designed to highlight trend alignment and structural shifts in price.
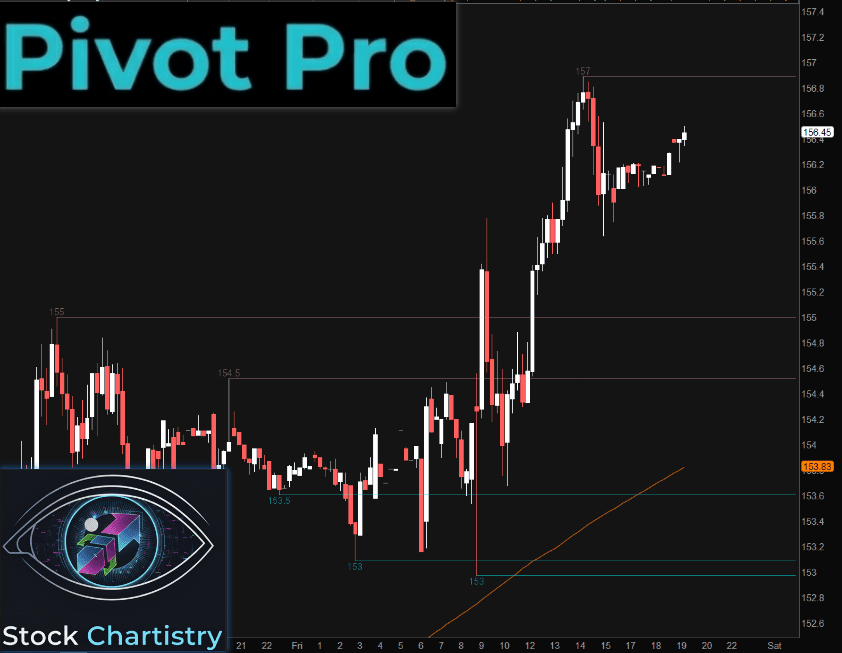
Pivot Pro
Automatically plots professional pivot structures used to identify support, resistance, and key decision levels.
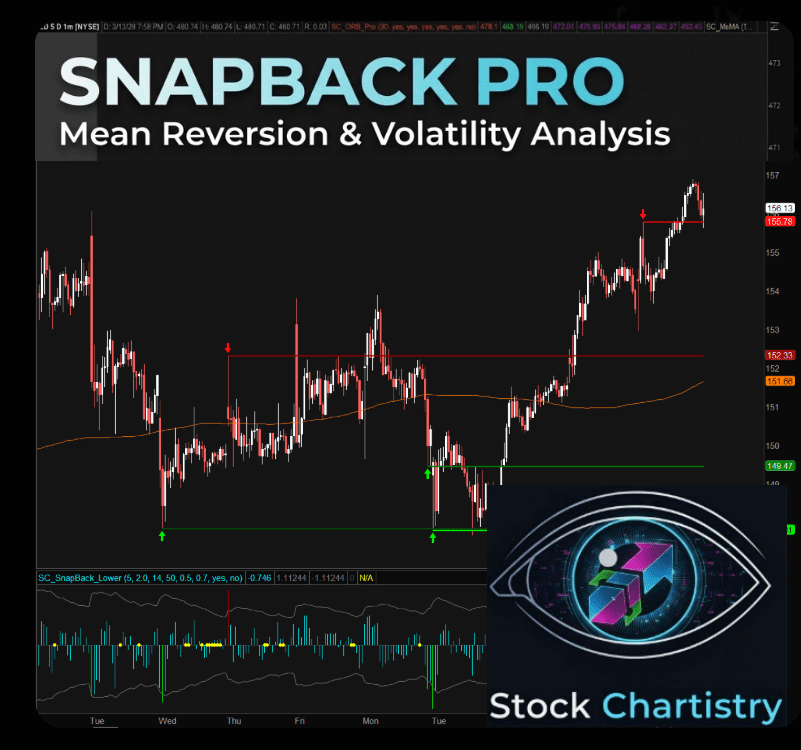
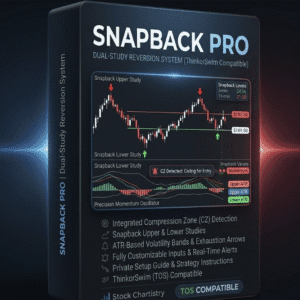
SnapBack Pro – Upper and Lower Studies
Detects extreme price moves and potential mean-reversion zones where markets often snap back.
Built for Swing Traders
Stock Chartistry indicators are designed specifically for the ThinkorSwim platform and built around one core principle:
Charts should reveal structure — not create noise.
The Swing Trader Toolkit helps traders:
• Identify dominant market trends
• Recognize key support and resistance levels
• Detect volatility extremes
• Improve timing of swing entries and exits
Best For Traders Who
• Focus on multi-day or multi-week trades
• Analyze daily and higher-timeframe charts
• Want clearer visibility into market structure
• Prefer clean charts with high-value indicators

Reviews
There are no reviews yet.