The Next Major Market Move Is Forming
A higher-timeframe roadmap for the indexes, macro assets, sector rotation, and the individual stock levels that could define August 2026.
The Next Major Market Move Is Forming: The Levels That Matter for August 2026
Stock Chartistry Monthly Market & Macro Analysis — July 2026 Closing Review
July did not end with a clean bullish declaration or a decisive bearish reversal. It ended with something more important: a market compressing near major technical boundaries while several cross-market forces move in opposite directions.
The broad indexes remain structurally bullish on their longest timeframes. The S&P 500, Nasdaq 100, Dow Jones Industrial Average, and Russell 2000 are all holding above important multi-year breakout zones. Yet the monthly and weekly charts are also producing dojis, inverted hammers, tightening ranges, lower highs, and moving-average resistance. Those are not automatic sell signals. They are decision structures. They tell us that the next major move is forming, but price has not yet confirmed its direction.
That distinction matters. A trader does not need to predict whether August will produce a breakout or a reversal. The job is to identify the levels that will confirm either outcome, understand which assets are providing confirmation, and then align shorter-term execution with the higher-timeframe structure.
This report begins with the monthly chart, moves through the weekly and daily charts, and then connects the major indexes to Bitcoin, gold, Treasury bonds, crude oil, sector rotation, and the largest individual stocks. The objective is not simply to describe what happened in July. It is to build an operational roadmap for August.
Executive Summary: A Bullish Structure Under Increasing Pressure
The market enters August with a constructive long-term trend but a more complicated intermediate-term posture.
SPY remains above its major breakout zones and continues to consolidate near all-time highs. That is bullish because sellers have repeatedly failed to force a sustained breakdown. However, the monthly doji and tightening daily range suggest that the next move may be larger than the recent day-to-day price action implies.
QQQ has endured a multiweek pullback led by profit-taking in semiconductors and mega-cap technology. The monthly chart remains extended, but the weekly chart is approaching areas where buyers may respond. This creates an important two-sided possibility: technology could bounce in August while still producing a lower high within a larger corrective structure.
The Dow remains relatively resilient as capital rotates toward older, more defensive, and more economically diversified companies. The Russell 2000 is also holding up better than rising interest rates would normally suggest. That resilience is constructive, but it creates a divergence that must eventually be resolved. Either rates stabilize and validate small-cap strength, or small caps begin responding more negatively to the rising cost of capital.
Outside equities, the message becomes more cautious. Bitcoin is struggling below major trend resistance and remains vulnerable if $60,000 fails. TLT continues to trend lower, which means long-term yields remain a pressure point for equity valuations. Crude oil has completed an important monthly breakout and back-test, and a renewed move toward $90, $95, or $100 could revive inflation concerns. Gold is attempting to form a base, but it still needs a decisive weekly trendline breakout and greater stability in the bond market.
The central August question is therefore not simply whether stocks are bullish or bearish. It is whether equity strength can survive continued pressure from rates and oil—and whether technology can recover without producing another failed rally.
The Timeframe Alignment Framework
The largest institutional investors do not make decisions from a five-minute chart. They use monthly, weekly, and daily structures to determine where capital should be accumulated, reduced, hedged, or rotated. Intraday charts are then used to improve execution.
| Timeframe | Primary Function | Trading Question |
|---|---|---|
| Monthly | Defines the macro trend, major breakout levels, and long-cycle risk | Is the asset structurally advancing, declining, or transitioning? |
| Weekly | Identifies swing channels, institutional support, and intermediate momentum | Is the pullback constructive, or is the larger trend beginning to fail? |
| Daily | Shows moving-average behavior, immediate support and resistance, and tradeable ranges | Where is the practical trigger, stop, and target? |
| Intraday | Refines execution and risk | Is price confirming the higher-timeframe thesis now? |
The highest-probability trades occur when these timeframes align. A bullish monthly trend, weekly support test, daily reversal, and intraday breakout create a very different opportunity from an intraday breakout that runs directly into weekly resistance.
The same principle applies to bearish trades. A short setup is stronger when the monthly chart is extended, the weekly chart forms a lower high, the daily chart loses a major moving average, and the intraday chart confirms that sellers have taken control.
Higher-timeframe analysis therefore does not eliminate short-term trading. It gives short-term trading context.
Part I: Major U.S. Market Indexes
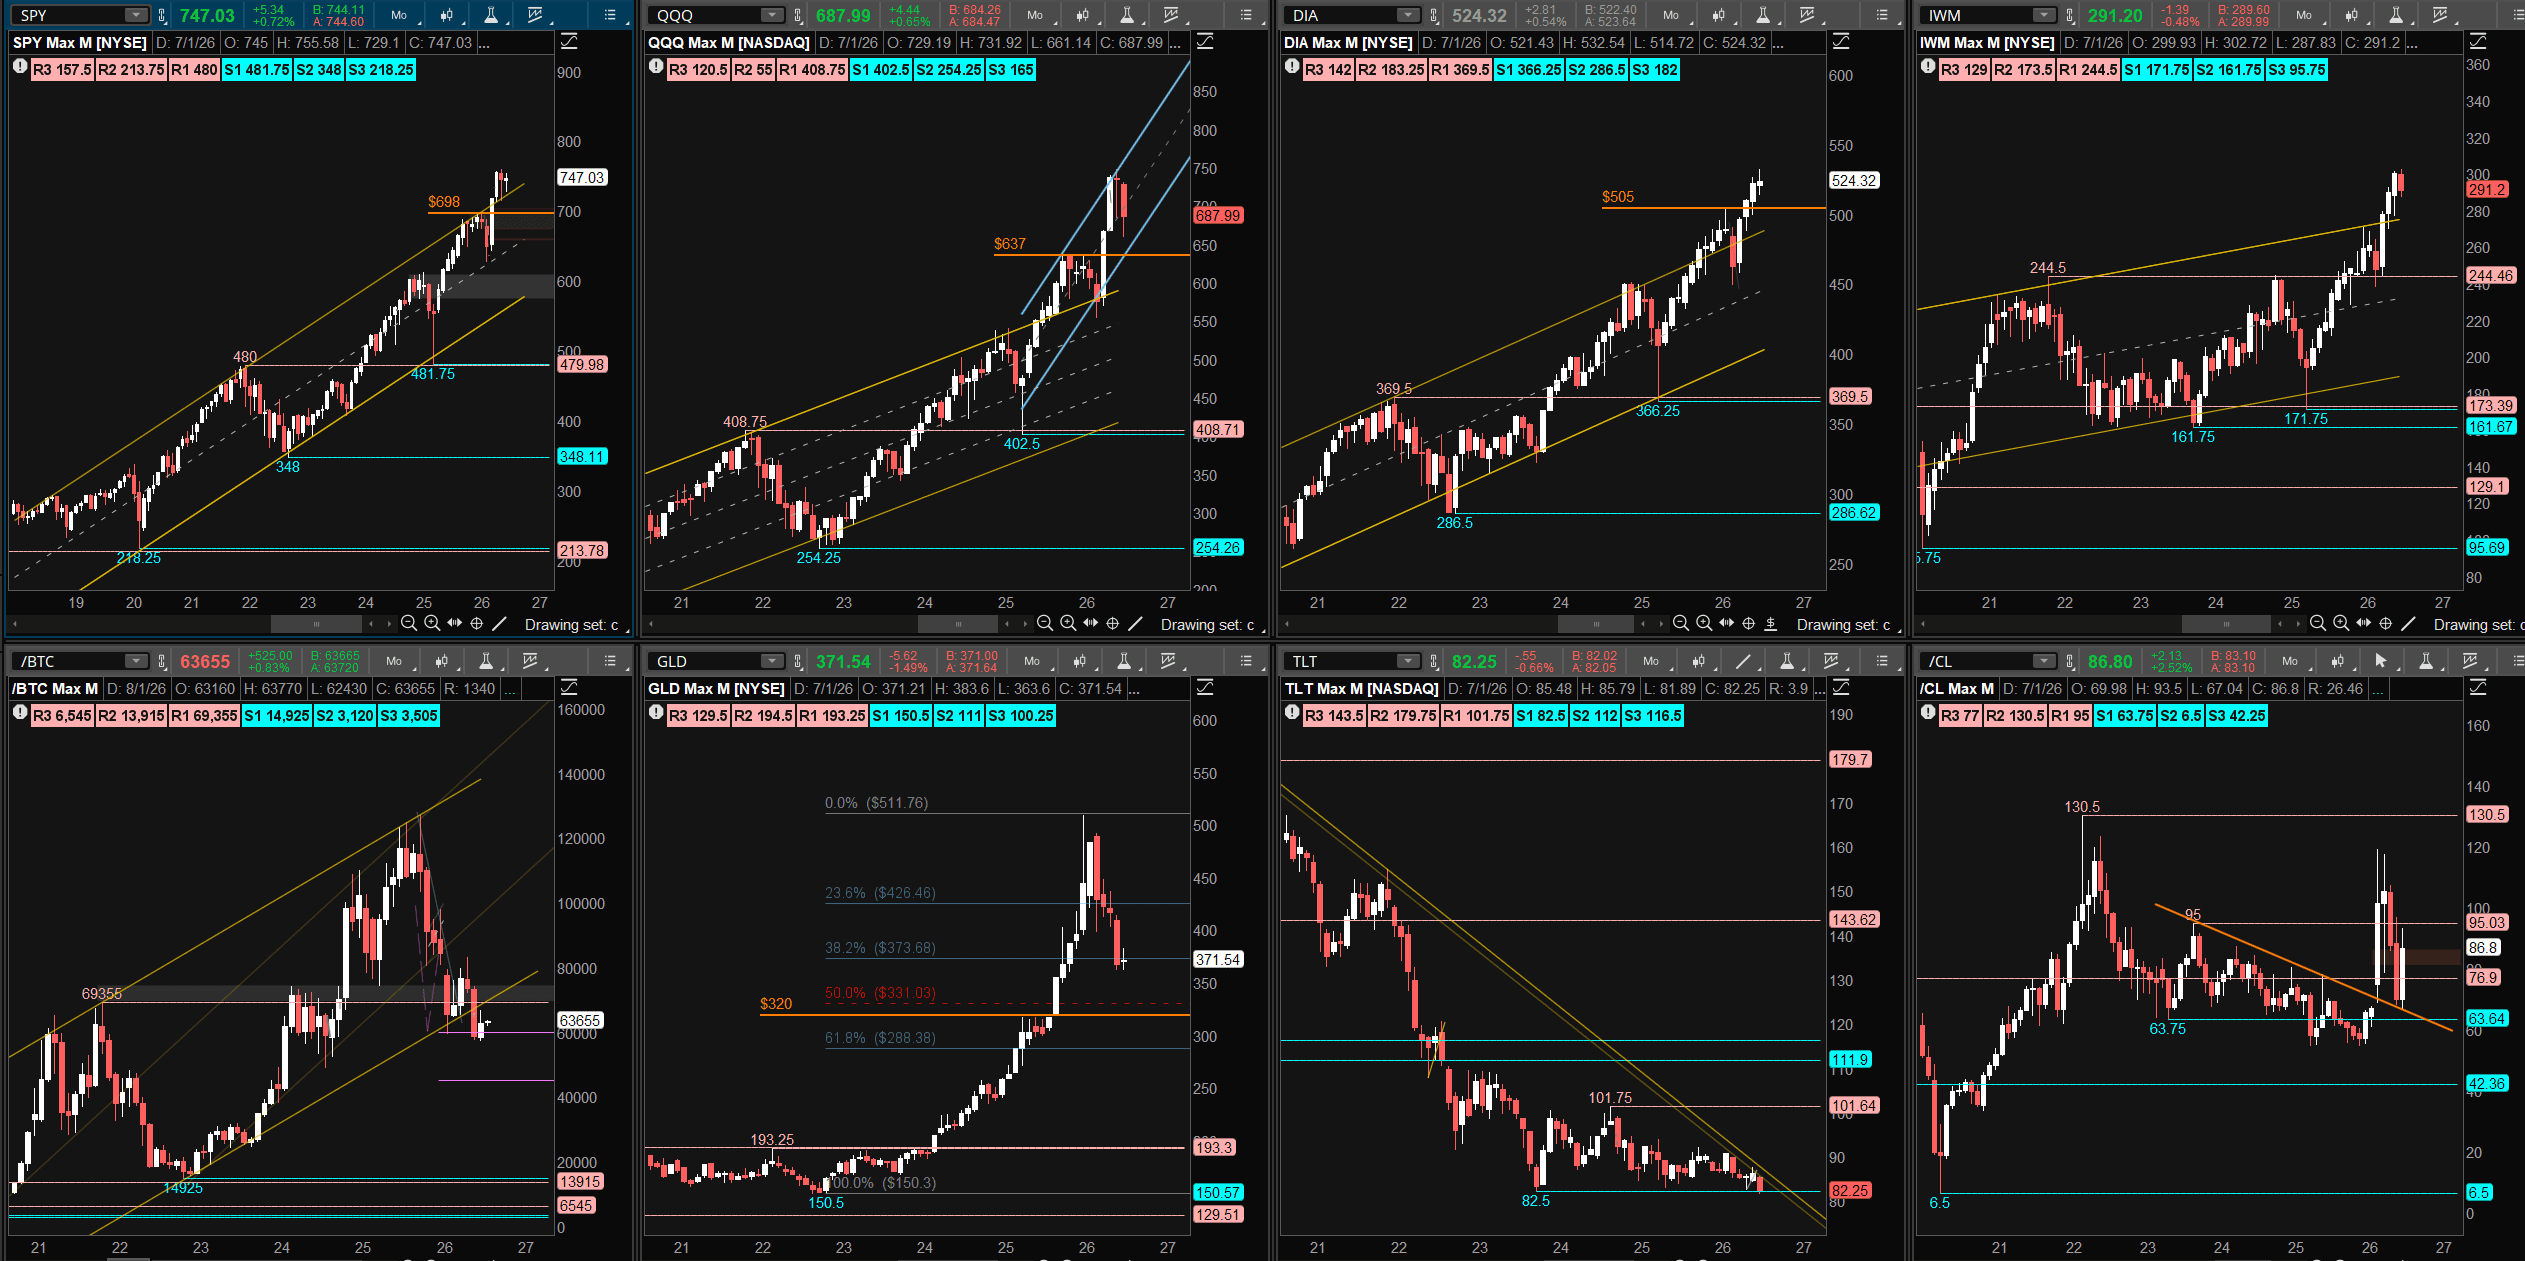
SPY: Bull Flag Near the Highs or the Beginning of a Larger Reversal?
Monthly structure
SPY remains in a long-term upward trend that accelerated sharply after the spring 2026 lows. The broader multi-year chart shows a market that spent years building a base, broke into a stronger trend after 2013, and has recently moved into a steeper trajectory.
Steeper trends can continue much longer than traders expect. They can also become parabolic. A parabolic structure does not identify the exact top; it tells us that price is advancing faster than the underlying long-term channel and that the eventual retracement may be substantial.
The most important feature on the July monthly chart is the doji near the highs. A doji represents equilibrium between buyers and sellers. Near the middle of a range, that may not mean much. Near an all-time high, after a major advance, it becomes a decision candle.
The bullish interpretation is straightforward: SPY has spent several months consolidating within the large May breakout bar. Instead of collapsing, it has corrected through time. That allows moving averages to catch up and can rebuild energy for another expansion. A decisive break above the July high and the upper portion of the recent range could open a rapid move toward the upper $700s and potentially $800.
The bearish interpretation is equally clear: failure below the July low would convert the doji into a reversal signal and expose the market to a retest of prior breakout support.
| SPY Level | Technical Meaning |
|---|---|
| $760–$765 | All-time-high resistance and breakout trigger |
| $725–$729 | Primary monthly and weekly support; loss changes market character |
| $698–$700 | Major breakout retest, 200-day moving-average confluence, likely reaction zone |
| Near $600 | Deeper macro downside only if the $698 structure fails decisively |
Weekly structure
On the weekly chart, SPY has spent roughly ten weeks near the highs without suffering a sustained loss of the breakout area. That persistence matters. The bears have created lower highs and occasional breakdown attempts, but buyers have continued to defend the lower boundary.
This produces a broad bull-flag interpretation. The market advanced, then moved sideways to slightly lower while holding above the prior breakout. Until support fails, the burden of proof remains on the bears.
However, the market has also struggled to regain momentum above $750–$760. Repeated failures near the same upper boundary can exhaust buyers. The longer price compresses between $729 and the all-time highs, the more meaningful the eventual break becomes.
A weekly close below approximately $725–$729 would be more important than an intraday violation. It would place price back inside the previous channel and transform former support into overhead resistance. That would increase the probability of a deeper test near $700.
Daily structure
The daily chart shows the compression most clearly. SPY has been trapped in a broad $722–$760 range, with price action becoming progressively tighter. This is not an environment where traders should chase every small breakout. Range-bound markets often produce false moves in both directions before the real expansion begins.
The practical approach is to treat the center of the range as low-quality territory. The best opportunities are likely to appear near the boundaries or after confirmed acceptance outside them.
A break above $760 that immediately fails would be a warning of a bull trap. A break above $760 followed by a successful retest would be much stronger. Likewise, a move below $722 that quickly recovers could become a bear trap, while sustained trade below $722 would increase the probability of a move toward $700.
The $698–$700 area deserves special attention because it combines a major prior breakout, psychological support, and a rising 200-day moving average. Even in a larger bearish scenario, that area should produce an initial reaction. The quality of that reaction would then tell us whether the decline is a buying opportunity or the beginning of a larger trend change.
QQQ: Technology Is Correcting, but the Larger Uptrend Is Not Yet Broken
Monthly structure
QQQ remains one of the market’s most important leadership indicators. It has historically shown enough strength to complete shallow back-tests rather than touching breakout levels precisely. That tendency is important when evaluating the current decline.
The primary monthly breakout level sits near $637. QQQ has already pulled back meaningfully from its highs, but it has not yet fully tested that area. The July low near $661 becomes the immediate trigger. If that low holds, the current decline can remain a normal consolidation within a larger uptrend. If $661 breaks, a continuation toward $637–$640 becomes increasingly likely.
The July monthly candle is bearish enough to demand respect, but it is not sufficient by itself to declare the technology bull market over. Price remains above the major structural breakout and inside the broader rising channel.
| QQQ Level | Technical Meaning |
|---|---|
| $731 | Major high and bullish expansion trigger |
| $688.25 area | Daily 20-period moving-average resistance |
| $661 | July monthly low and continuation trigger |
| $637–$640 | Major breakout retest and high-confluence long-response zone |
Weekly structure
QQQ has declined for approximately six consecutive weeks, with semiconductors and mega-cap technology leading the weakness. A six-week decline feels bearish on a daily basis, but the weekly context remains more constructive than the emotion surrounding the selloff.
Price is still within a larger rising channel and is moving toward the weekly 20-period moving average. That is where institutions often begin reassessing risk. A controlled decline into weekly support can create an excellent tactical opportunity, particularly if momentum stabilizes and daily price action begins forming higher lows.
The important nuance is that a bounce does not automatically restore the bull trend. Because the monthly chart remains extended, an August rebound could terminate below the previous high and create a lower-high structure. Traders should therefore distinguish between a support bounce and a confirmed resumption of leadership.
Daily structure
The daily chart is weaker. The 20-day moving average has curled lower and has acted as resistance near $688.25. A rising moving average tends to support pullbacks. A flat moving average often becomes a center of gravity. A declining moving average becomes a ceiling.
QQQ must reclaim and hold above that moving average to improve the immediate trend. Failure there keeps the descending channel active and leaves the $637–$645 region in play.
The best long setup would not be a blind purchase simply because price reaches support. It would be a test of the support zone followed by evidence that sellers are losing control: a doji, hammer, bullish engulfing candle, higher low, or trendline break on the daily or hourly chart.
DIA: Defensive Rotation Keeps the Dow Resilient
The Dow has behaved differently from the Nasdaq because its composition includes more mature industrial, healthcare, financial, consumer, and defensive companies. During periods when high-growth technology is under pressure, capital can rotate into these areas rather than leaving equities entirely.
Monthly and weekly structure
DIA broke above the major $505 pivot and continues to hold that breakout. July printed a doji between approximately $513 and $532. As with SPY, this is a decision candle near the highs.
The larger trend remains constructive while $505 holds. A break above $532 would confirm continued expansion. A break below $513 would expose $500–$505 and increase the probability that the recent rounded structure is becoming a top rather than a consolidation.
The weekly chart has begun to curl over slightly. That does not yet equal a breakdown, but it shows that upside momentum is slowing. The difference between a normal pause and a rollover will be determined by whether buyers continue defending the low-$500s.
Daily structure
DIA is range-bound between roughly $513 and $532. Until that range breaks, traders can continue treating the lower boundary as potential support and the upper boundary as potential resistance. The danger is assuming the range will last indefinitely.
After several months of compression, the probability of expansion rises. Once price closes and holds outside the range, the strategy should shift from fading the boundaries to trading in the direction of the breakout.
IWM: Small-Cap Strength Is Constructive—but Rates Create a Major Contradiction
The Russell 2000 is one of the most interesting charts because its price action is stronger than the interest-rate backdrop would normally justify. Small companies tend to be more sensitive to borrowing costs, refinancing conditions, and domestic economic demand. Yet IWM continues to hold within a rising monthly and weekly channel.
Monthly structure
July produced an inside-bar hammer within a larger uptrend. That is constructive. An inside bar reflects contraction, and a hammer shows buyers defending lower prices. A break above the inside bar could trigger a move toward the $300–$320 region.
The immediate issue is that IWM is near the upper portion of its longer-term channel. It may need to retest support before producing a sustainable breakout.
Weekly and daily structure
The weekly decline has been methodical rather than impulsive. Price is making slightly lower highs and lows, but there are no major panic candles. That suggests a countertrend pullback rather than confirmed structural failure.
The daily chart is more cautious. Price is below a rolling-over 20-day moving average, has lost the 50-day moving average, and may be approaching a bearish 20/50 crossover. Those signals point toward further testing.
The strongest confluence sits between approximately $270 and $279. That area combines horizontal support, the lower portion of the weekly trend structure, and the rising 200-day moving average. A successful test could create an attractive long setup. A decisive failure would finally align IWM with the negative message from the bond market.
| IWM Zone | Meaning |
|---|---|
| $300–$320 | Upper-channel targets if the monthly inside bar resolves higher |
| $277.50–$280 | Initial support and decision zone |
| $270–$271 | Major confluence support and potential institutional response area |
Part II: Crypto, Commodities, Bonds, and Macro Confirmation
Bitcoin: $60,000 Is the Line Between Stabilization and a Much Deeper Decline
Bitcoin is no longer behaving like a clean leadership asset. The monthly chart has broken below its prior rising channel, completed a weak back-test, and formed a bearish inverted-hammer/inside-bar structure.
The weekly chart shows prolonged consolidation near $60,000. That level has attracted buyers repeatedly, which means it is genuine support. It also means that a confirmed failure would be significant because many of those buyers would suddenly be trapped.
The downside model points toward approximately $45,000 if $60,000 breaks decisively. That target aligns with a broader structural area and represents a much more complete reset of the prior advance.
On the daily chart, Bitcoin is forming an elongated bear flag beneath a declining 50-day moving average and descending trend resistance. The previous $67,000 reclaim level has effectively moved higher as the downtrend line advances through time. Bitcoin now needs to recover approximately $70,000 or more to invalidate the bearish structure.
There may still be tradable bounces from $58,000–$60,000. However, a bounce is not the same as a trend reversal. The burden remains on buyers to reclaim resistance.
Gold: A Long-Term Opportunity May Be Developing, but Confirmation Is Missing
Gold experienced a remarkable long-term advance from its multi-year base, then became extended near the $500-plus region. The current correction is therefore not surprising. Strong trends require consolidation, retracement, or both.
The monthly chart suggests that gold could continue correcting toward the $320–$350 region. That area overlaps with the prior breakout and a typical 50%–61.8% retracement zone. A retracement of that size would feel severe, but it could remain technically constructive within the larger bull trend.
The weekly chart is the immediate obstacle. Gold remains below a descending trendline that has controlled price for several months. Until that line breaks, long positions face persistent overhead supply.
The $350–$355 region is beginning to show support through repeated lower wicks and hammer-like candles. Long-term investors may consider scaling rather than trying to identify one exact bottom, but tactical traders should still wait for confirmation.
The daily 20-period moving average is flattening, which suggests that downside momentum is slowing and a base may be forming. Yet price still faces resistance near $400 and around the longer-term moving averages.
Gold’s next sustained advance will likely require one or both of the following: stabilization in Treasury bonds or renewed inflation/geopolitical pressure strong enough to outweigh rising real yields.
TLT and Interest Rates: The Most Important Warning Underneath the Equity Market
TLT remains in a persistent downtrend. Because bond prices and yields move inversely, continued weakness in TLT means long-term yields remain elevated or are moving higher.
This matters across the market. Higher yields increase discount rates for growth stocks, pressure real estate and utilities, raise borrowing costs for small companies, and compete with equities for capital.
The monthly chart is pressing the lower boundary of a multi-year range near $82.42. The weekly chart continues to form lower highs and lower lows, with $83.30 acting as a lost pivot. The daily chart produced a small hammer, so a short-term relief bounce is possible, but the larger trend has not improved.
A recovery above approximately $82.77 on the immediate chart would provide modest relief. A more meaningful change would require TLT to break its weekly downtrend and begin producing higher lows.
Until then, every equity breakout must be evaluated against the possibility that rising yields will restrict valuation expansion.
Crude Oil: The Inflation Risk the Equity Market Cannot Ignore
Crude oil has completed one of the clearest higher-timeframe technical developments in the report. It broke above a multi-year monthly downtrend, returned to test that breakout near $63–$64, and held.
That back-test transforms the old downtrend line into support. As long as the $63 region holds, the long-term structure remains constructive.
Oil is volatile because the technical setup is interacting with geopolitical risk, supply concerns, strategic reserve policy, and inflation expectations. The weekly chart suggests that price may still need to complete a retest near the apex of a prior triangle, placing the $95–$100 region in focus.
The daily chart shows nearer resistance around $90, followed by approximately $92.60, $95, and $97. A first test of $90 may produce a pullback. A successful second attempt could open the path toward $100 and beyond.
That scenario would matter far beyond the energy sector. A renewed oil surge could increase headline inflation, keep yields elevated, pressure consumer spending, complicate Federal Reserve policy, and create margin pressure across transportation and industrial companies.
Oil near $90 is therefore not merely an energy trade. It is a macro trigger.
Part III: Sector Rotation and Market Breadth
Technology and Semiconductors: Extended Monthly, Supportive Weekly
XLK and SMH capture the central contradiction in technology. On the monthly chart, both remain extended above their long-term moving averages. That argues for either a deeper pullback or an extended period of sideways consolidation.
On the weekly chart, however, both are approaching the 20-week moving average, which often attracts buyers during healthy bull-market corrections. This means a tactical August bounce is entirely reasonable even though the monthly chart still requires further normalization.
The practical implication is to avoid treating every technology bounce as proof that the correction is complete. A strong response from weekly support can be traded, but the rebound must eventually reclaim prior highs to restore full leadership.
Semiconductors deserve particular attention because they often lead the broader technology complex. If SMH stabilizes while QQQ remains weak, that would be constructive. If SMH breaks weekly support, the technology correction could deepen rapidly.
Consumer Discretionary and Communications: Similar Charts, Different Opportunities
XLY is testing its monthly 20-period moving average for approximately the fourth time. Repeated tests weaken support because each test consumes some of the remaining demand. A break would expose the lower portion of the longer-term range.
Amazon’s strong earnings response may help XLY stabilize, but one stock cannot permanently overcome deterioration across the rest of the sector.
XLC presents a more attractive long-term structure. It is completing a first meaningful test of a rising monthly moving average, which historically offers better risk-reward than a fourth or fifth test. The sector remains influenced by Alphabet and Meta, so those individual charts will be critical.
Software: A Base Is Developing Beneath Resistance
IGV remains below its monthly 20-period moving average, which prevents a fully bullish long-term reading. The weekly chart is improving, however. Price broke a downtrend, back-tested the prior breakout region, formed a double bottom, and is now challenging the 50-week moving average.
This is the type of structure that can transition from repair to leadership if resistance is reclaimed. Until then, software remains a developing base rather than a confirmed breakout.
Financials and Industrials: Relative Strength, but Not Without Extension Risk
XLF and XLI remain among the strongest cyclical groups. Financials have benefited from a steeper rate environment and continued economic resilience, while industrials remain in a persistent upward trend.
Both sectors are somewhat extended from their monthly moving averages. That does not make them bearish, but it reduces the attractiveness of chasing strength. The better entries are likely to come from controlled pullbacks toward the 20-period moving average or successful retests of recent breakout zones.
XLI’s ability to hold its recent breakout near the upper $170s will help determine whether industrial leadership continues into August.
Real Estate and Utilities: One of These Markets May Be Mispriced
XLRE continues to show resilience despite rising yields. That creates an unusual divergence because real estate is generally rate-sensitive. Either the bond market is exaggerating future rate pressure, or XLRE has not yet fully responded.
The safer interpretation is to respect the price action while recognizing the mismatch. If XLRE holds its rising channel and TLT begins recovering, the divergence may resolve bullishly. If yields continue rising, XLRE becomes increasingly vulnerable.
XLU has pulled back toward its long-term moving average and is near the lower portion of its weekly range. Utilities could bounce from this area, particularly if investors seek defensive exposure. Sustained upside would be easier to trust if yields stabilize.
Energy and Healthcare: Inflation Leadership and Defensive Leadership
XLE is consolidating near major breakout territory while crude oil remains structurally bullish. If oil resumes its advance, energy equities could become one of August’s strongest groups. The key is whether XLE can hold its 20-week moving average and build acceptance above the recent breakout.
XLV is operating from a different catalyst. Healthcare is receiving defensive capital and has formed a bull flag near all-time highs. A breakout above approximately $165 could create blue-sky momentum.
However, XLV is already extended. Traders should be prepared to take profits into a parabolic move rather than assuming that defensive leadership cannot become overbought.
Consumer Staples and Materials: Slow Strength Versus Cyclical Uncertainty
XLP continues to climb steadily along its long-term moving averages. It is not a high-beta trading vehicle, but it can serve as a lower-volatility destination when investors want equity exposure without taking technology-level risk.
XLB has been flatter and more uncertain. Its behavior is linked to global growth, commodity prices, construction demand, and rates. A successful test of the weekly moving average could improve the setup, but the sector has not demonstrated the same relative strength as industrials, financials, energy, or healthcare.
Part IV: Mega-Cap and High-Interest Stock Setups
Apple: The $300 Area Is the Immediate Battleground
Apple attempted to accelerate above its long-term channel but finished with a substantial upper wick. That warns that supply appeared at higher prices.
The broader structure remains intact while the $290 breakout region holds. On the daily chart, price produced a snap-back low near the psychologically important $300 level following earnings.
A recovery could target the gap near $317, followed by trendline resistance in the $324–$335 area. A sustained loss of $290 would be more damaging because it would invalidate the breakout and place Apple back inside the prior structure.
Amazon: Strong Earnings Create Momentum, but Chasing Carries Risk
Amazon printed one of the stronger post-earnings reactions, producing a bullish engulfing structure and moving toward the top of its multi-month channel.
The immediate challenge is extension. Price is above short-term moving averages and approaching resistance around $274–$278. Sideways consolidation beneath that area would be constructive because it would allow moving averages to catch up without giving back the earnings move.
A confirmed break above $274–$278 could target $290–$300. A sharp rejection would suggest that the earnings gap is being used for profit-taking.
Alphabet: A High-Timeframe Doji With a Clear Expansion Trigger
Alphabet holds a large monthly doji with important support near $317. The daily and hourly charts showed buyers defending trend support with precision.
The stock remains constructive above approximately $335–$336. Reclaiming $378 would represent a major upside trigger and could open a longer-term move toward $425.
Because the monthly doji is large, traders should avoid treating small intraday movements as decisive. The most meaningful signal will be acceptance beyond the higher-timeframe boundaries.
Meta: The Weakest Mega-Cap Structure Until Proven Otherwise
Meta remains in a descending channel with lower highs and lower lows. Its rallies are being capped by declining moving averages, which means the stock is still operating in a sell-the-rally environment.
Potential resistance sits around $570–$592. A rally into that zone followed by rejection would reinforce the bearish structure. The larger support region near $441 becomes relevant if the decline accelerates.
Meta can certainly produce sharp oversold rallies, but the chart does not become structurally bullish until it breaks the descending channel, reclaims major moving averages, and begins forming higher lows.
Microsoft: Strong Reclamation, Better Bought After Consolidation
Microsoft produced one of the strongest post-earnings weekly bars among the mega-cap names. It reclaimed its broader rising channel, cleared the 200-day moving average, and broke horizontal resistance in one move.
That strength is meaningful, but it also creates short-term extension. The snap-back high near $467 may cap the first attempt higher.
The better setup would be a controlled pullback that holds the breakout or a sideways consolidation that allows the short-term moving averages to catch up. Chasing immediately after a vertical move creates poor risk-reward even when the long-term thesis is bullish.
Nvidia: A Range Trade Until $212.50 Breaks
Nvidia remains trapped in a high-volume consolidation zone. Flat moving averages confirm that neither buyers nor sellers have established a durable trend.
The most important support sits near $196, with a lower boundary around $185. Resistance sits near $212.50, followed by $240 and a larger Fibonacci objective near $254.
Inside the range, the practical strategy is to accumulate or look for long reactions near support and reduce exposure near resistance. A decisive close above $212.50 would change the character of the setup and support a move toward $240. A loss of $185 would invalidate the range and expose lower levels.
Tesla: Volatile Downtrend With a Tradable Trigger
Tesla remains inside a broadening downward structure. The monthly and weekly charts show volatility rather than clean trend control.
The $290–$300 area is the primary structural support zone. On the daily chart, Tesla is extended below its 20-day moving average and has formed a doji-like decision structure.
A reclaim of approximately $315 would be the first constructive trigger and could target a gap fill near $337. Failure to hold $290 would leave the broader downtrend in control.
Netflix: A Potential Reversal, but the Trendline Must Break
Netflix has already reached a major ABC downside projection near $71 and is attempting to stabilize between approximately $65 and $78.
The stock is pressing against a descending weekly trendline. That pressure is constructive because repeated tests can weaken resistance, but there is no confirmed breakout yet.
A move above $75–$76 would begin repairing the technical damage and could activate an inverse head-and-shoulders style reversal toward $78.44 and potentially higher. Risk should remain defined below approximately $64.50 because a failure there would invalidate the developing base and expose the next lower target near the low-$50s.
August 2026 Trading Blueprint
The market is approaching a point where several months of compression may resolve into a larger move. The correct response is not to become more certain than the charts justify. It is to become more prepared.
First, respect the monthly dojis. SPY, QQQ, and DIA are near important boundaries. A break above their July highs would support renewed expansion. A break below their July lows would activate deeper retests.
Second, watch TLT and crude oil together. Falling TLT and rising oil would create the most difficult combination for equities because it would reinforce both rate pressure and inflation pressure. Stabilizing bonds and cooling oil would give technology, small caps, real estate, and utilities more room to recover.
Third, distinguish tactical bounces from structural reversals. QQQ, SMH, XLK, gold, Bitcoin, Meta, and Netflix may all produce strong rebounds from support. Those rebounds become durable only when they reclaim the trendlines and moving averages that currently define resistance.
Fourth, pay attention to sector rotation. Continued strength in financials, industrials, energy, healthcare, and staples alongside weak technology would indicate that the market is rotating rather than collapsing. Broad weakness across both leadership and defensive sectors would be more concerning.
Fifth, align entries with higher-timeframe levels. QQQ near $637–$640, IWM near $270–$279, Nvidia near $196, Apple near $290–$300, and Bitcoin near $60,000 are not automatic trades. They are locations where traders should begin looking for confirmation.
Key Levels Dashboard
| Market | Bullish Confirmation | Primary Support | Bearish Confirmation |
|---|---|---|---|
| SPY | Sustained break above $760–$765 | $725–$729, then $698–$700 | Weekly acceptance below $725 |
| QQQ | Reclaim $688, then challenge $731 | $661, then $637–$640 | Monthly continuation below $661 |
| DIA | Break above $532 | $513, then $500–$505 | Sustained loss of $513 |
| IWM | Break toward $300+ | $277–$280, then $270–$271 | Failure of the $270 confluence zone |
| Bitcoin | Reclaim $70,000+ | $60,000 | Confirmed break below $60,000 |
| Gold | Break weekly downtrend and reclaim $400 | $350–$355, then $320 | Failure below the breakout-retest zone |
| TLT | Reclaim near-term pivots and break weekly downtrend | $82.42 area | Continued lower lows |
| Crude Oil | Clear $90, then $95–$100 | $80, then $63–$64 | Failure of the monthly breakout support |
Final Market Read
The long-term bull market remains alive, but August begins with less room for complacency.
SPY is holding near record highs, yet it is trapped inside a tightening range. QQQ is approaching meaningful support, but it remains below declining daily resistance. The Dow and Russell continue to show resilience, though the Russell’s strength conflicts with the rising-rate environment. Bitcoin remains vulnerable, gold is building rather than breaking out, Treasury bonds are warning that yields remain a problem, and crude oil is positioned to become a renewed inflation catalyst.
That combination does not support an all-in bullish or bearish posture. It supports selective participation, disciplined risk management, and a willingness to change direction when the levels confirm the next move.
The market does not owe us a clean prediction. It gives us boundaries. Above those boundaries, buyers are in control. Below them, sellers are gaining control. Between them, patience is a position.
The next major market move is forming. The advantage belongs to the trader who already knows which levels matter before the move begins.
Stay grounded, follow the chart, manage the risk, and stay on the right side of the trade.
This analysis is for educational and informational purposes only and is not financial advice. Trading and investing involve risk, including the possible loss of principal.
Stock Chartistry
Visit StockChartistry.com | Indicators and Products | Follow Stock Chartistry on X